The usual motivation behind the computation of the P/T ratio is a desire to determine if a measurement procedure is adequate for a given production process. And there are two ways that measurements support a production process: They can be used to scrape the burnt toast (inspection), or they can be used to learn how to stop burning the toast (process improvement). If the measurement system is adequate to allow us to improve the process, then we can often get to the point where we no longer have to depend upon inspection to ship conforming product. So of these two ways that measurements support production, the role of process improvement is the more critical in the long term.
Will the measurements support process improvement?
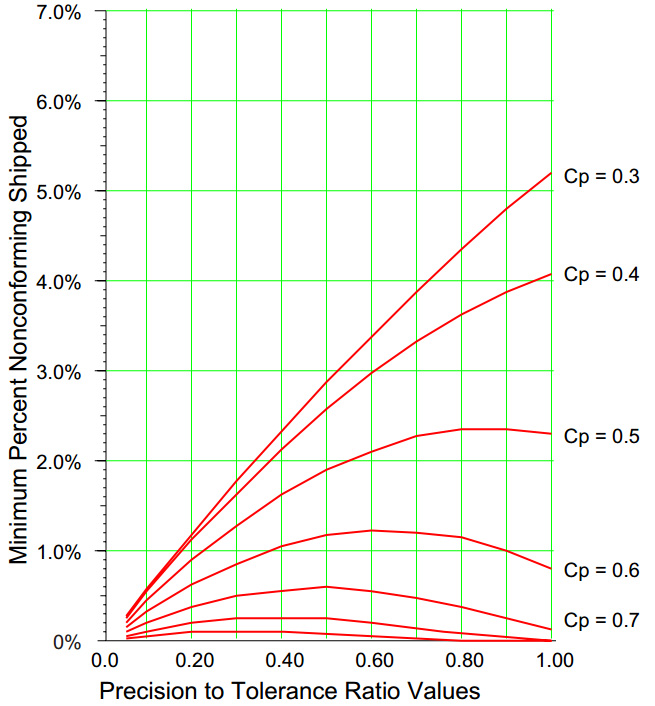
Figure 7: Minimum percentages of nonconforming product shipped
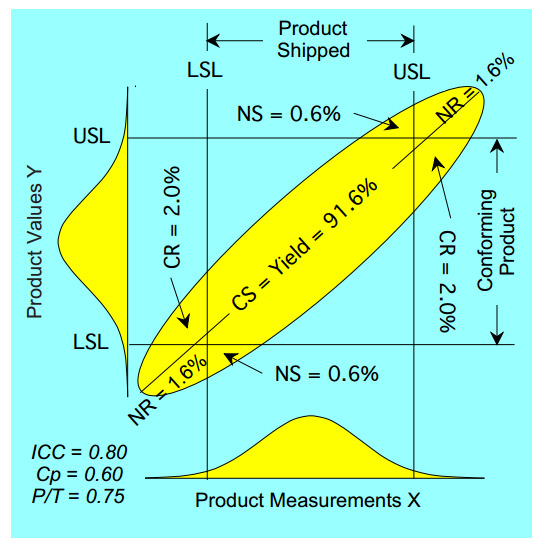
The product measurements, X, will consist of the product values, Y, plus measurement errors, E. The relationship between X and Y may be modeled with a bivariate normal distribution. The ellipse in figure 6 shows the three-sigma contour of a bivariate normal distribution having an ICC value of 0.80 and a capability ratio of 0.60.
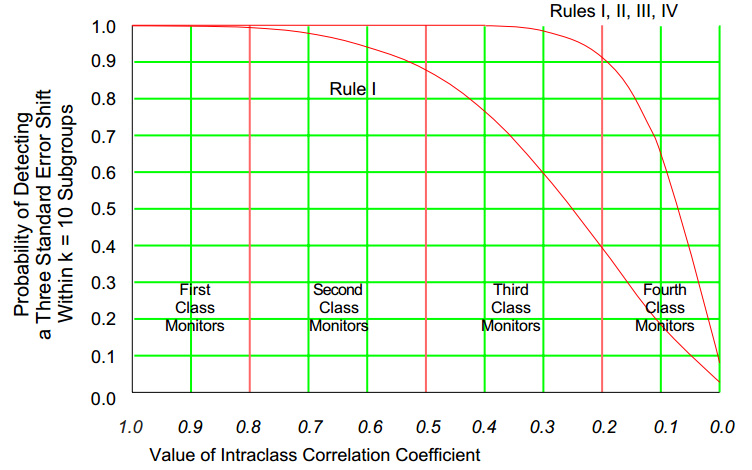
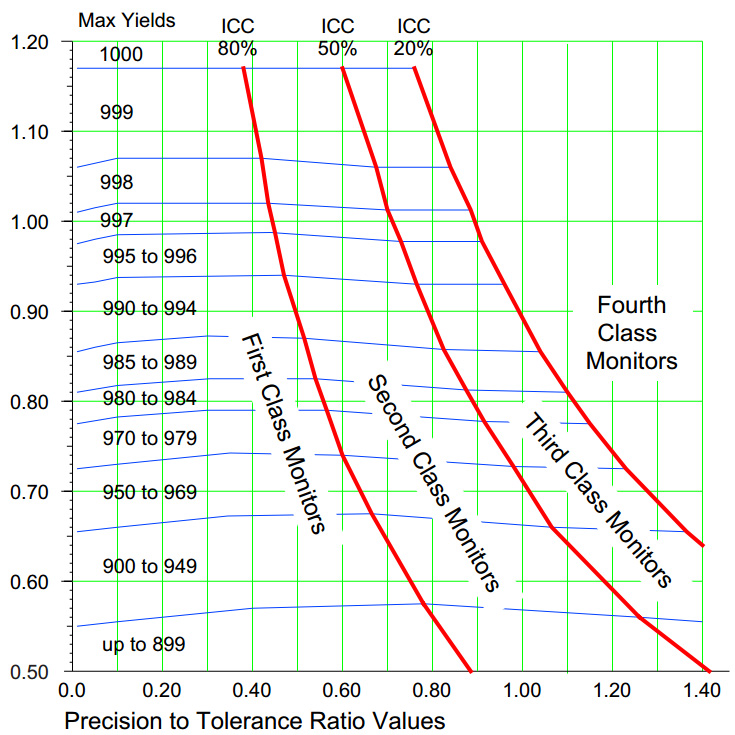
When the ICC falls below 0.20, the measurements contain very little information about the product. These fourth-class monitors are essentially useless for process improvement.
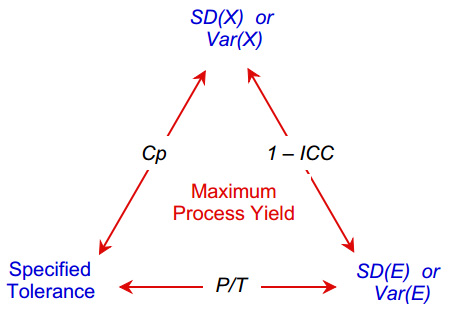
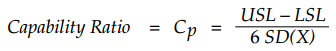
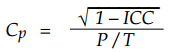
Three ratios are commonly used to compare the quantities on the corners of the triangle. The capability ratio, Cp, compares the specified tolerance with the (within subgroup) standard deviation of the product measurements:
So please consider turning off your ad blocker for our site.
The following is provided for those interested in duplicating the results shown in the graphs. The relationship between the product values, Y, and the product measurements, X, can be modeled using a bivariate normal distribution as shown in figure 6. In this model, the minor axis of the ellipse is a function of the measurement error.
These ratios are related in the manner shown by the following equation. This means that knowledge of any two of these ratios will completely define the third.
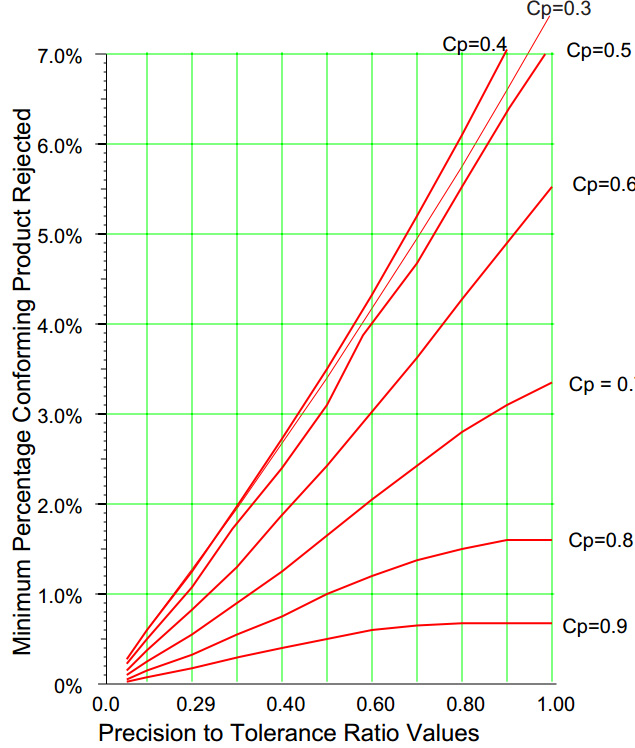
Figure 8: Minimum percentages of conforming product rejected
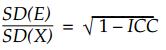
The maximum process yield depends upon three quantities: the specified tolerance; the variation in the measurement process, SD(E); and the variation in the stream of product measurements, SD(X).
The precision to tolerance ratio compares the standard deviation of the measurement process with the specified tolerance.
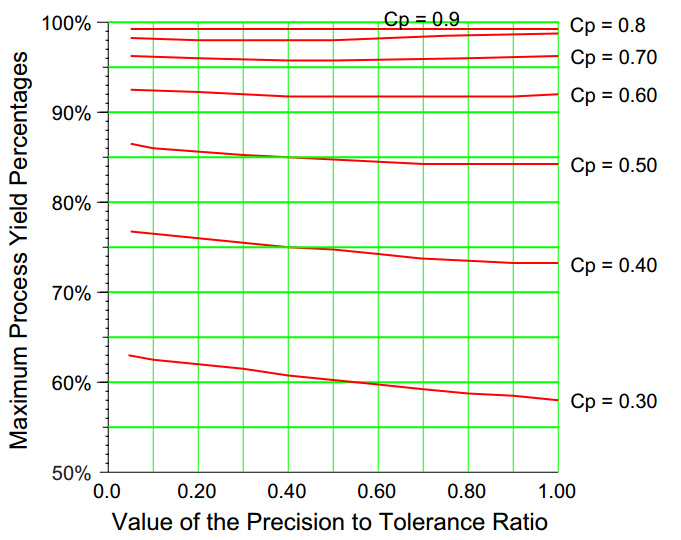
For example, if your P/T ratio is 0.60 and your capability ratio is 0.80, your process will have a maximum process yield of about 980 ppt. Operating predictably and on-target will result in about 980 conforming units shipped per thousand units produced. Operating at less than full potential will result in a lower yield.
Inspection places a premium on having a good measurement system. When a process is operated unpredictably or off target, the misclassifications will increase beyond the minimums given above. The costs of improving the measurement system, plus the costs of inspection, rework, and scrap, will lower productivity without increasing the quality of the product shipped. I have had clients who were so comfortable with inspection that they put on more inspectors, increased the size of the rework department, and slowly went out of business.
The proportion of conforming product (C) that gets rejected (R) by the specifications will be approximated by the volume under the bivariate model in the regions labeled CR. This is a misclassification that occurs due to measurement error.
The proportion of nonconforming product (N) that gets rejected (R) by the specifications will be approximated by the volume under the bivariate model in the regions labeled NR.
Without loss of generality we may assume:
For the role of process improvement, we need a measurement system that allows us to detect those changes in our process that are large enough to be of economic impact. To see how a measurement system affects the ability of a process behavior chart to detect process changes, we will use the intraclass correlation coefficient.
Figure 3 shows the information of figure 2 in a different format and extends the coverage to lower capability ratios. Here each curve represents a fixed value for the capability ratio while the maximum process yields are shown on the vertical axis.
So, the P/T ratio does not limit the maximum process yields. Neither does it characterize the relative usefulness of the measurements for keeping process behavior charts. But does it tell us anything about using the measurements to scrape the burnt toast?
Inspection
With appropriate changes in the limits of integration, we can use the equation above to find volumes for the regions CR, NS, and NR for any given combination of the P/T and capability ratios.
When the intraclass correlation is greater than 0.80, the measurement system is a first-class monitor for that production process. A process behavior chart using detection Rule 1 alone has better than a 99% chance of detecting a three-standard error shift.
Figure 8 shows the minimum percentage of conforming product that will get rejected for a given capability and P/T ratio when the process is operated up to its full potential.
However, someone has to pay for this content. And that’s where advertising comes in. Most people consider ads a nuisance, but they do serve a useful function besides allowing media companies to stay afloat. They keep you aware of new products and services relevant to your industry. All ads in Quality Digest apply directly to products and services that most of our readers need. You won’t see automobile or health supplement ads.
![]()
Our PROMISE: Quality Digest only displays static ads that never overlay or cover up content. They never get in your way. They are there for you to read, or not.
Using published tables of the power functions for process behavior charts, we can compute the probabilities of detecting various sized shifts for various values of the intraclass correlation. Here we shall consider detecting a three-standard-error shift within ten subgroups of when that shift occurs. Figure 4 shows two curves: The lower curve is for the use of detection rule one alone, while the upper is for the use of all four Western Electric zone tests. The interesting thing about both curves is how slowly they drop off as the intraclass correlation goes to zero.
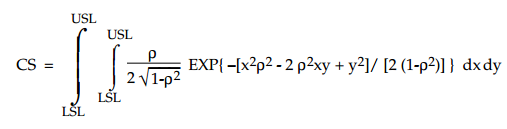
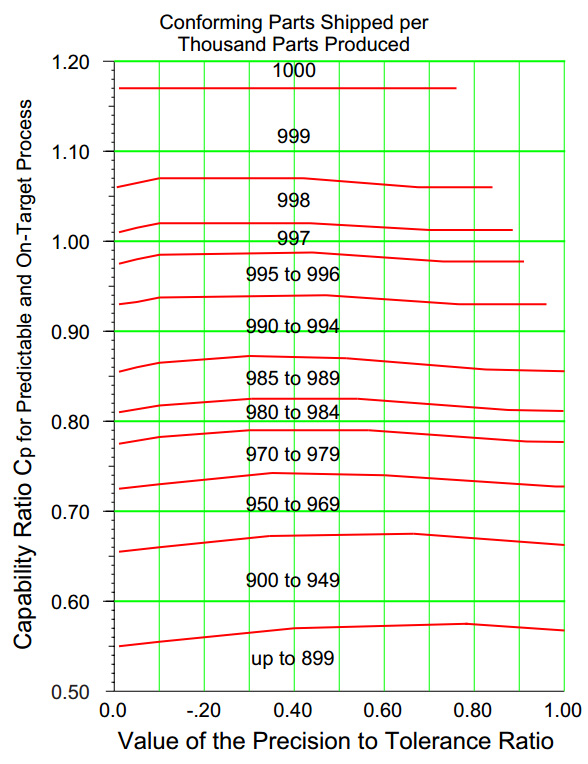
Figure 2: How maximum process yields change with P/T and capability
Then, for a given P/T ratio and a given capability ratio, we may find the ICC value and compute the maximum process yield by integrating the resulting bivariate normal distribution with respect to both X and Y over the region labeled CS (i.e., between the specification limits).
Quality Digest does not charge readers for its content. We believe that industry news is important for you to do your job, and Quality Digest supports businesses of all types.
As we learned last month, the precision to tolerance ratio is a trigonometric function multiplied by a scalar constant. This means that it should never be interpreted as a proportion or percentage. Yet the simple P/T ratio is being used, and misunderstood, all over the world. So how can we properly make use of the P/T ratio?
So that the ratio of SD(E) to SD(X) will be given by:
Thanks,
Quality Digest