One critical aspect of GMP is the analytical product quality review (APQR), an essential process for evaluating and monitoring the consistency of product quality throughout its life cycle. APQR is also known as annual product review (APR) in the U.S. Food and Drug Administration, and product quality review (PQR) in EU good manufacturing practice (GMP) guidelines. It is required to be conducted annually for every product to determine the need for changes in drug product specifications or manufacturing or control procedures.
Centralized monitoring of critical control points: The APQR system establishes tolerances for critical control points (CCP) and escalates any excursions beyond proven acceptable range (PAR) or outside the normal operating range (NOR). This proactive alerting mechanism ensures swift corrective actions for every batch manufactured.
Compliance to three sigma: APQR aligns with statistical process control methodologies, ensuring compliance to three sigma acceptance criteria. This data-driven approach enhances the precision and reliability of product quality assessments.
Continued process verification (CPV): APQR facilitates CPV by providing continuous monitoring of critical parameters throughout the manufacturing process. This proactive approach ensures ongoing compliance and quality assurance.
Real-time data availability before batch release: A digital APQR ensures that all relevant data are available in real time before batch release, enabling proactive decision making and minimizing the risk of quality issues escaping detection.
Digital solutions, such as those from AmpleLogic—a front-runner in providing innovative solutions for the life sciences industry—offer a comprehensive platform designed to address the challenges associated with PQR and elevate APQR processes.
• Control charts are used to track critical quality attributes (CQAs) and critical process parameters (CPPs) over time. Any trends, shifts, or out-of-control points on the chart can signal potential issues that need investigation.
• Specification limits are compared to the control chart data to ensure that the process is consistently producing results within the defined specifications.
• Control limits on control charts help identify statistically significant variation in the process. Points beyond these limits may indicate special cause variation that requires investigation.
• Although CPV includes ongoing monitoring of the process, the initial validation batch data serve as a baseline for expected performance. Deviations from the validated state may trigger further investigation and corrective actions.
• In CPV, Ppk (process performance index) calculations help quantify how well the process is meeting specifications. A high Ppk value indicates a capable process, while a low value may suggest a need for process improvement.
• PAR is the demonstrated range of process parameters that consistently produces a product meeting its predefined quality attributes. It is determined through the validation process and represents the acceptable variation in the parameters that ensure product quality.
• NOR is the specified range within which process parameters are expected to operate under routine manufacturing conditions. It is often set within the wider PAR and represents the typical operating conditions for day-to-day production.
Database maintenance challenges: Managing a vast database with one document per year for each product becomes a significant challenge. This approach requires extensive storage facilities, which adds real estate cost and can impede efficient retrieval and analysis of historical data because there is a regulatory requirement of maintaining the approved APR documents for a minimum of 11 years.
These include:
However, challenges in the industry related to PQR have highlighted the need for innovative solutions. This article will leave you with a little more understanding about the challenges associated with PQR in the life sciences industry and how modern digital solutions can elevate the APQR while bridging existing gaps.
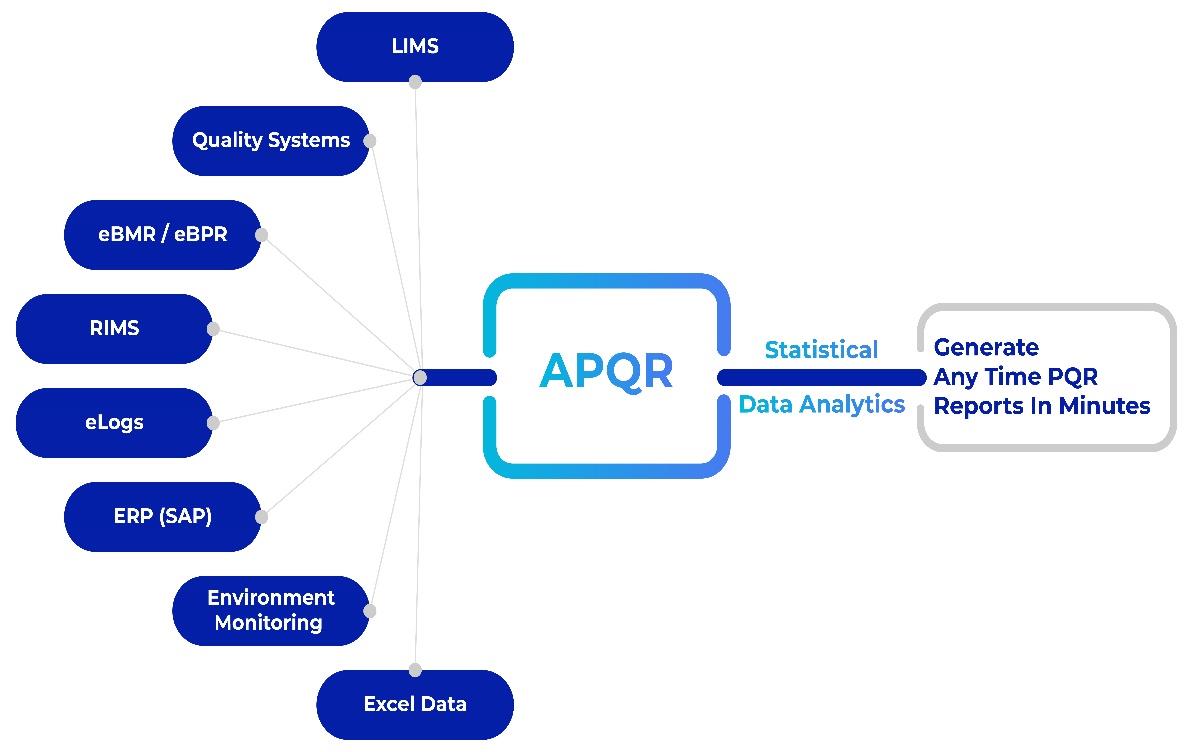
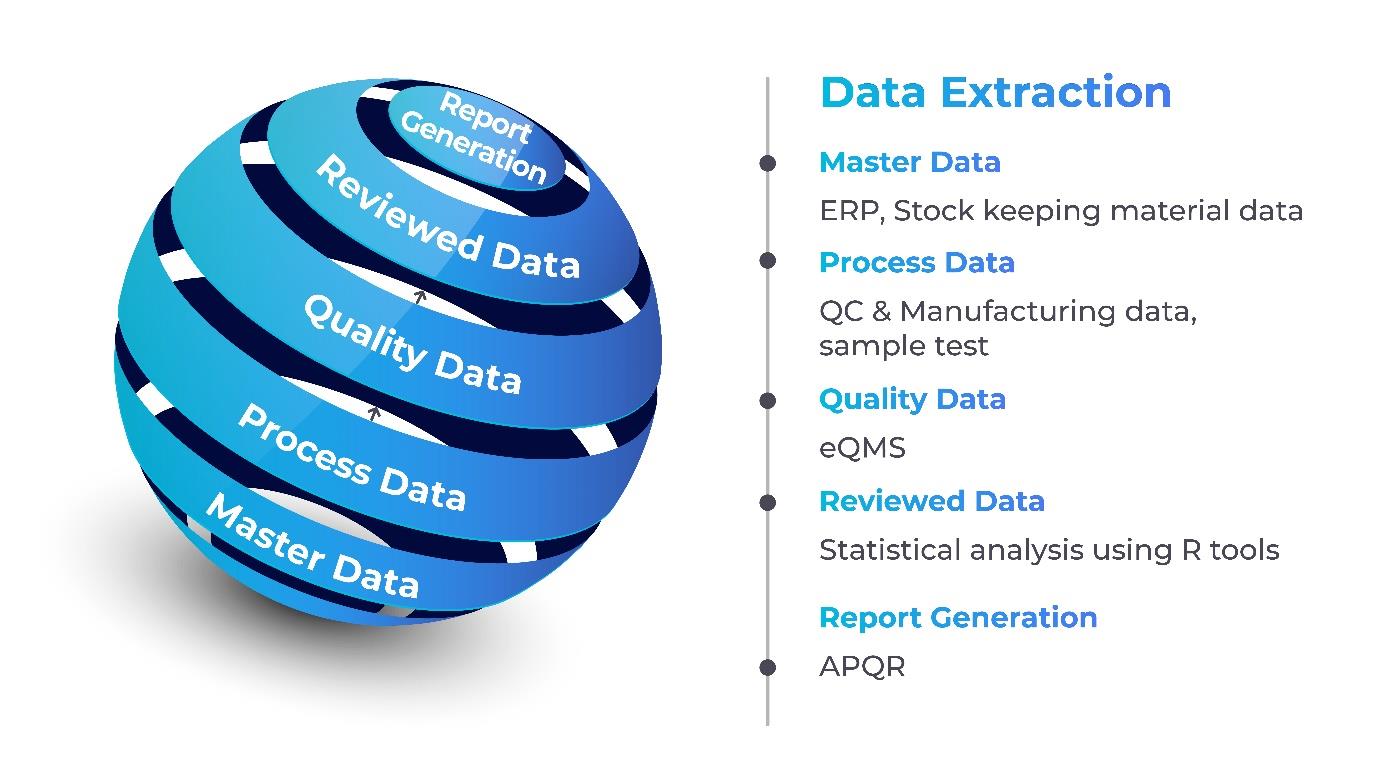
Automated data collection and analysis: A digital APQR platform automates the data collection process, reducing manual errors and streamlining the analysis of vast datasets. This ensures the timely generation of APQR reports, enhancing overall operational efficiency.
Integrated analytical functionality: APQR integrates comprehensive analytical functionalities, eliminating the need for external analysis tools, ensuring a seamless and efficient APQR experience.
Diversity in templates across sites and product types: The use of multiple templates across different sites and product types introduces complexities in data standardization and analysis. This diversity hampers the ability to derive meaningful, standardized insights from APQR reports.
Anytime reviews and report creation: By simplifying and automating the process, users can create virtual or interim PQRs, allowing them to routinely assess the state of their processes and review the progress of their continuous improvement initiatives.
Integration hurdles for electronic adoption: The transition to electronic APQR is hindered by integration challenges, making it difficult for companies to seamlessly incorporate electronic processes into their existing workflows.
AmpleLogic’s platform stands out as a robust solution, offering automated processes, regulatory compliance management, integration capabilities, and real-time monitoring at reduced costs. Through this technology, companies can enhance their APQR processes, bridge existing gaps, and confidently navigate the pharmaceutical industry’s complexities. Modernizing the APQR process also brings benefits like electronic collaboration, streamlined regulatory report compilation, time savings, and improved data analysis, which facilitates quicker and more routine informed decisions regarding product quality.