But what does this really tell us about the process? Is 1.33 expected to be the population parameter? If so, does testing 30 samples provide us with this information? The capability index calculated from 30 samples is only the statistic and not the parameter.
Always keep on learning….
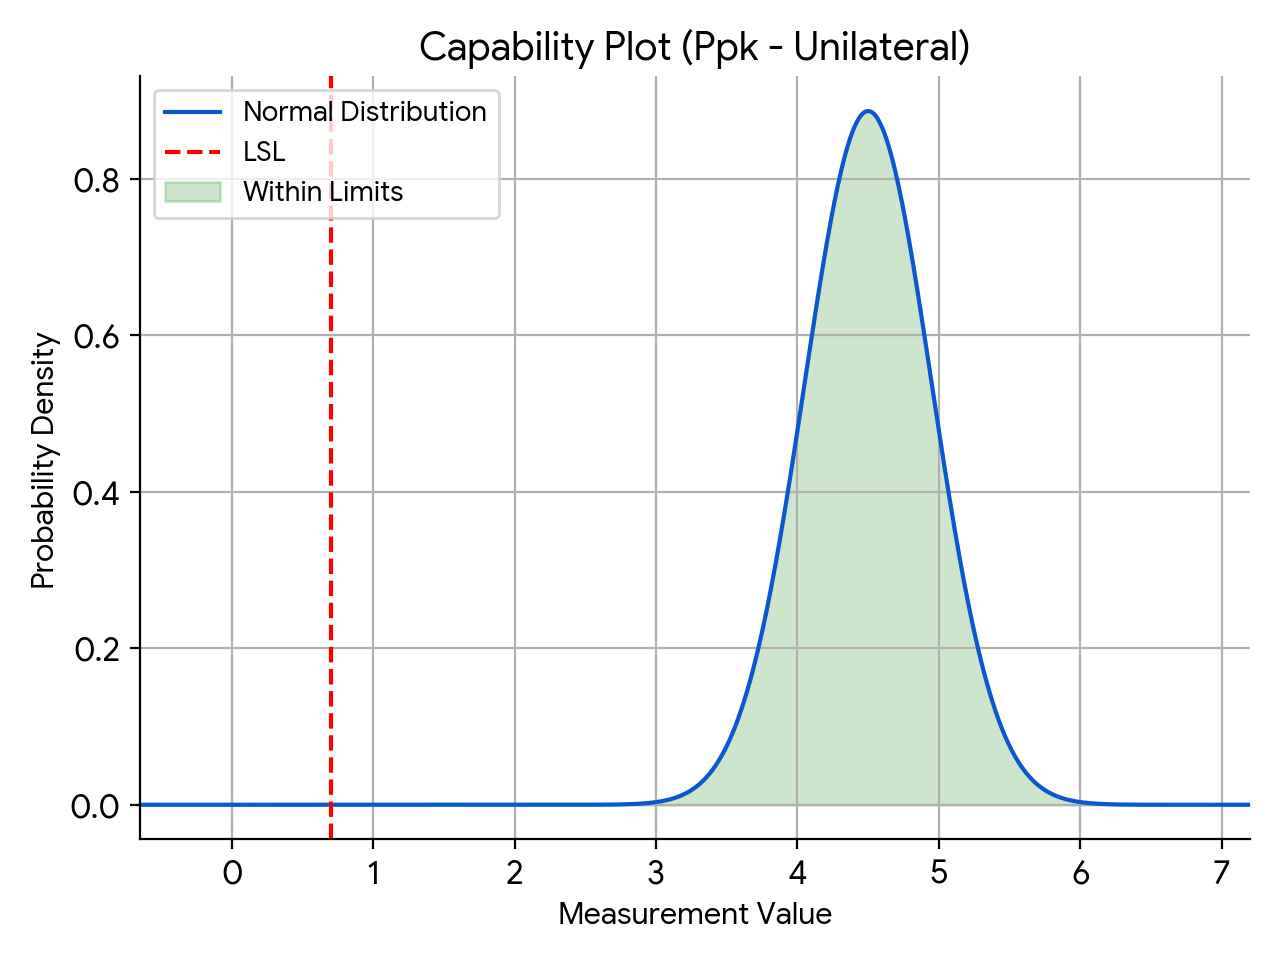
A quality engineer is tasked with assessing the capability of a sealing process. The requirement the engineer is used to is that the process capability index, Ppk, must be greater than or equal to 1.33. The engineer is used to using 30 as the sample size.
This approach is also used for variable sampling plans. However, please do note that the bilateral specification also requires an additional condition to be met for variable sample plans.
In this article, I’m looking at the relationship between capability index (Cpk or Ppk) and tolerance intervals. The capability index is tied to the specification limits, and tying this to the tolerance interval enables us to use the confidence/reliability statement allowed by the tolerance interval calculation.
We can use the tolerance interval calculation approach here and calculate the one-sided k-factor for a sample size of 30. Let’s assume that we want to find the tolerance interval that will cover 99.9% of the population with 95% confidence. NIST provides us with a handy reference to calculate this, and we can use an Excel spreadsheet to do this for us. We see that the one-sided k-factor calculated is 4.006.
With 95% confidence, at least 99.9% of the population conforms to the specifications. In other words, with 95% confidence, we can claim at least 99.9% reliability.
I have attached a spreadsheet that will enable you to perform these calculations easily. I welcome your thoughts. Please note that the spreadsheet is provided as-is with no guarantees.
Final words
I’ll finish with the history of the process capability indices, as outlined in a great article by Roope M. Turunen and Gregory H. Watson.
Published April 21, 2024, on Harish’s Notebook.